
How much time do you spend in your Google Analytics account?
It can become a serious addiction, there is a ton of data about your website/business, you can spend hours on end mulling through it. In fact, if you wanted to, you could become Google Analytics Certified.
However, you don’t need to be an expert to gain value from your Google Analytics account. With a few glances you can quickly determine who your target audience/demographic is, which marketing channels are working and the overall health of your website traffic.
I try to spend a handful of hours each month to digest the data, find meaningful conclusions and develop goals.
Below is some data from the PureFilters Google Analytics account that took me no more than 30 seconds to pull, along with a little bit of commentary.
Overall Traffic Growth
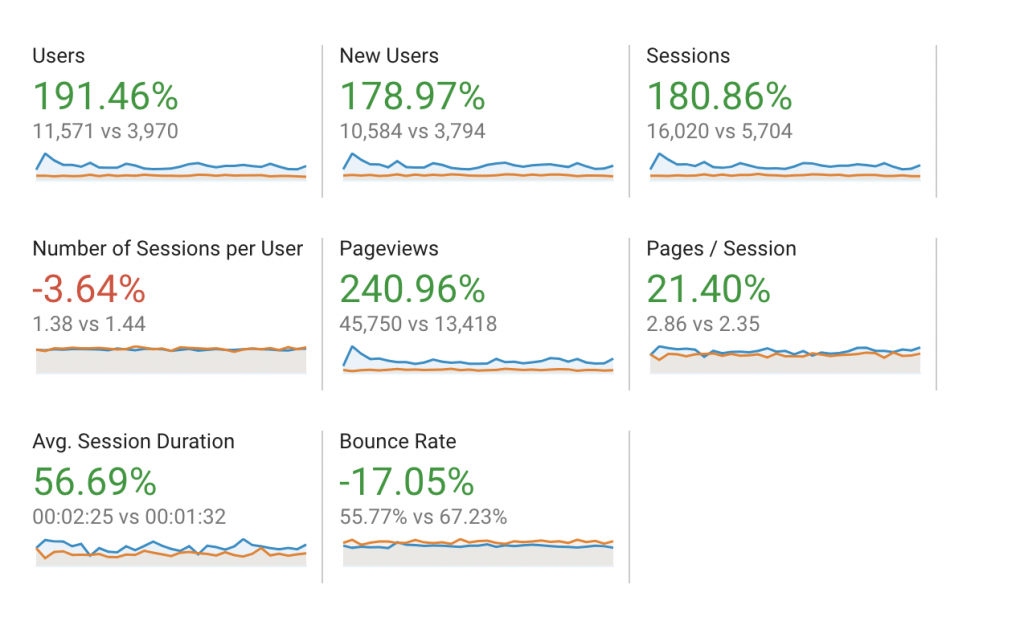
To view this data in your account, go to Audience then Overview.
The data above compares basic traffic stats from March 2019 vs. March 2018. No real surprise there given the growth of PureFilters. It’s nice to see the bounce rate decreasing, we’ve made some minor tweaks on the website to enhance user experience, however we still have a long way to go.
We are planning a full website redesign this year, it will be interesting to see what happens to the bounce rate after that.
Conversion Sources
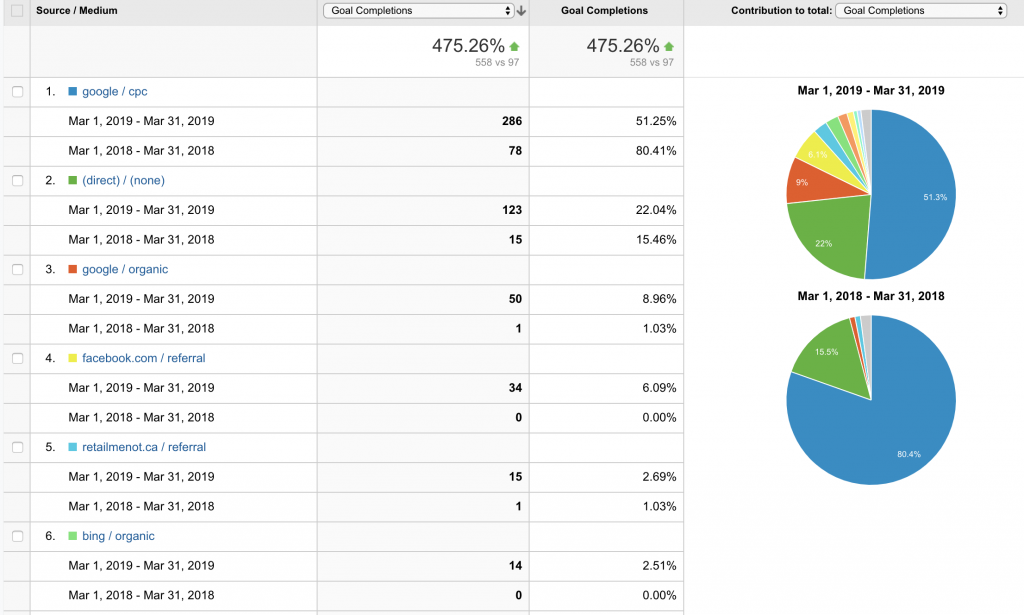
To view this data in your account, go to Conversions then Goals then Overview then Source/Medium.
This is data that I am really proud of. In March 2018, over 80% of our online conversions was generated through Google Ads (in blue). In September 2018, we made it part of our company strategy to diversify our digital customer acquisition, and I am happy to say that we have executed on this initiative.
As of March 2019, only around 50% of our conversions come from Google Ads, the rest from various sources including Facebook, Bing and direct traffic (the best kind of traffic).
We will continue to diversify our digital channels, but I believe Google Ads will always be the dominate channel, the ROI there is simply phenomenal.
Demographics
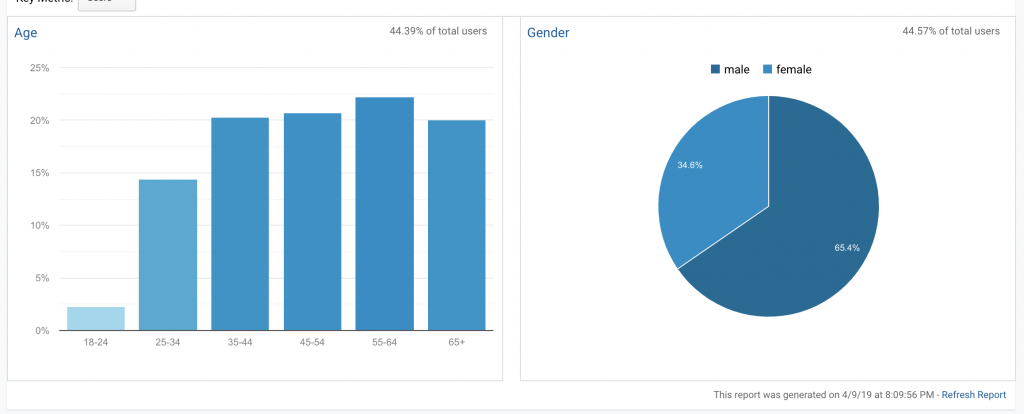
To view this data in your account, go to Audience then Demographics then Overview.
Typically, homeowners are the ones responsible for purchasing and replacing their furnace air filter. Homeowners are generally older, so the fact that our our audience age group skews older is completely logical. Also, it’s often the man of the house that is responsible for maintaining it, so its also logical that our audience skews more male.
For PureFilters, understanding these demographics is important when it comes to tailoring content on our blog, social media posts or targeting on Facebook Ads.
Conclusion
Google Analytics reveals a lot of telling data about your website/business. As discussed above, within just 30 seconds, I quickly learned that:
- The small tweaks to our website improved user experience
- Marketing efforts outside of Googles Ads are working
- Our “buyer persona” is an older, male homeowner
Try performing this 30-second Google Analytics check each month, see what kind of conclusions you can draw about your business. It can help guide your company’s strategy and help achieve its goals.
Cordially,
Hi there! I’m Jay Vasantharajah, Toronto-based entrepreneur and investor.
This is my personal blog where I share my experiences building businesses, making investments, managing personal finances, and traveling the world.
Subscribe below, and expect to get a couple of emails a month with some free, valuable, and actionable content.


