
NOTE: this was a past issue of my weekly newsletter, Timeless Gems. Join my free mailing list so you don’t miss out on future issues.
Today’s gem is this table which outlines 3 different scenarios where $1m is invested, and a 19% IRR (internal rate of return) is generated.
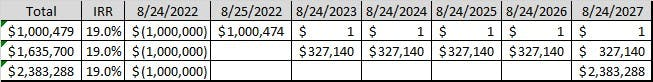
Despite the profits from each of the above scenarios ranging from $479 to $1,383,288, all 3 scenarios generate a 19% IRR. This is why I say IRR is more of a marketing metric than anything else. It also outlines the dangers of relying on a single metric when assessing investment performance. Whenever a metric or KPI becomes widely accepted, it’s bound to be gamed, and IRR is no exception (I’m looking at you EBITDA as well).
The IRR formula is time-based and assumes money is reinvested at the same rates throughout the hold period. It incentivizes managers to return capital and profits as fast as possible. In some scenarios, this might make sense, but in others, it might not. Investments that return capital fast have two main disadvantages: you need to find somewhere else to reinvest the cash + you need to pay taxes more frequently. Whether these disadvantages are big issues really depends on your investor base.
I know the above example is taking extreme ends of the spectrum, but, which of the 3 scenarios would you prefer?
At Atlasview Equity, we prefer using MOIC (multiple on invested capital) as the main investment return metric when underwriting deals. We want to generate an acceptable level of absolute profits for our investors. Ideally, we want to find businesses that have reinvestment opportunities so the capital we invest can compound over our holding period.
I took this table from Barrett’s tweet. Give him a follow!


